History of Histogram

The history of the histogram dates back to the 18th century, when English mathematician John Wallis used this graphical representation to show the frequency of different letters in the English alphabet. However, it was not until the mid-19th century that the histogram was developed into the tool we know today.
The modern histogram was first introduced by Karl Pearson, a British mathematician and statistician, in 1895. Pearson was studying the distribution of physical and biological characteristics, such as height and weight, and he found the histogram to be a useful tool for visualizing this type of data.
At around the same time, Italian mathematician and engineer, Francesco Carletti, also developed a similar graphical representation, which he called a "e;polygon of frequencies."e; However, it was Pearson's work that gained wider recognition and popularity.
In the early 20th century, the histogram was further developed and refined by other statisticians and mathematicians, including G. Udny Yule and R.A. Fisher. Yule introduced the concept of class intervals and showed how the histogram could be used to estimate the probability density function of a continuous random variable. Fisher, on the other hand, emphasized the importance of choosing appropriate bin sizes in order to accurately represent the data.
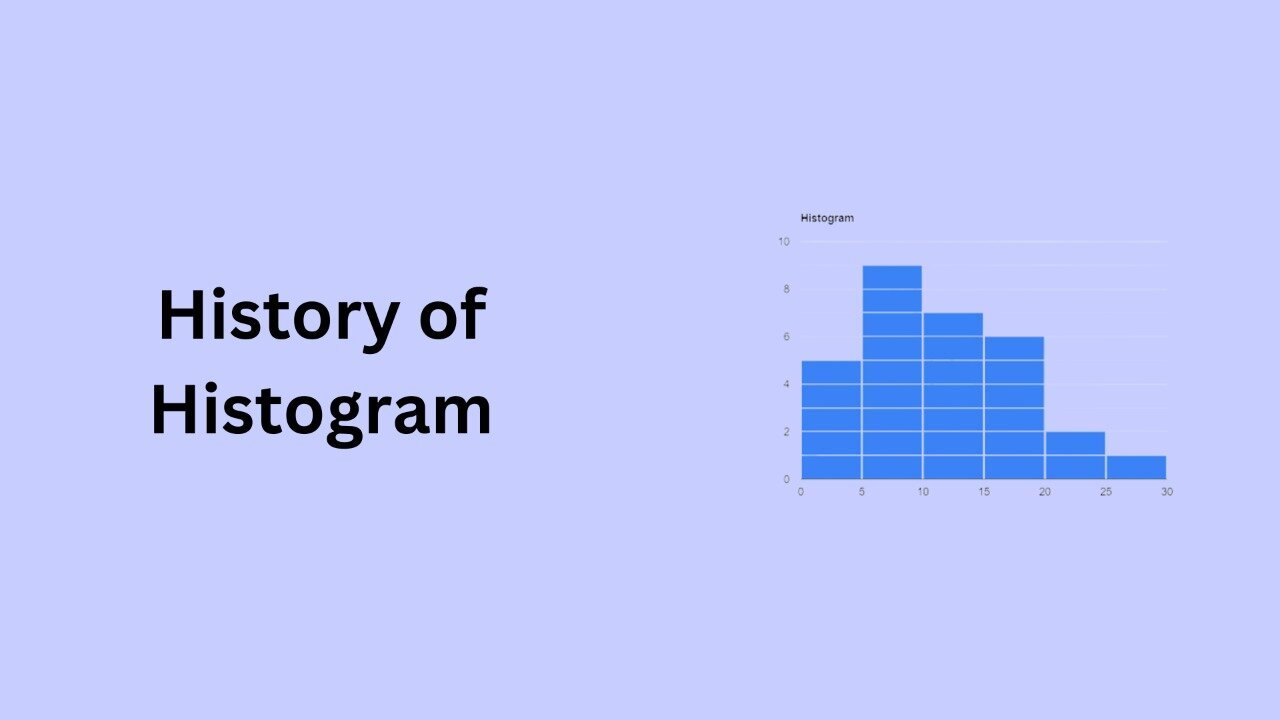
Over the years, the histogram has become an important tool in a variety of fields, including engineering, economics, and the social sciences. It is commonly used in statistical analysis to visualize the distribution of a dataset and to identify patterns and trends. The histogram is also a useful tool for comparing datasets and for identifying outliers or unusual observations.
Today, the histogram is a standard feature in many statistical software packages and is widely used by researchers and analysts to gain insights into their data. It continues to evolve and be refined, with new techniques and methods being developed to improve its accuracy and usefulness.
In conclusion, the histogram has a rich history dating back to the 18th century. It has evolved from a simple graphical representation of the frequency of letters in the alphabet to a powerful tool for visualizing and analyzing numerical data. Despite its long history, the histogram remains a valuable and widely used tool in many fields, and will likely continue to be an important part of statistical analysis for years to come.