What is a Histogram?
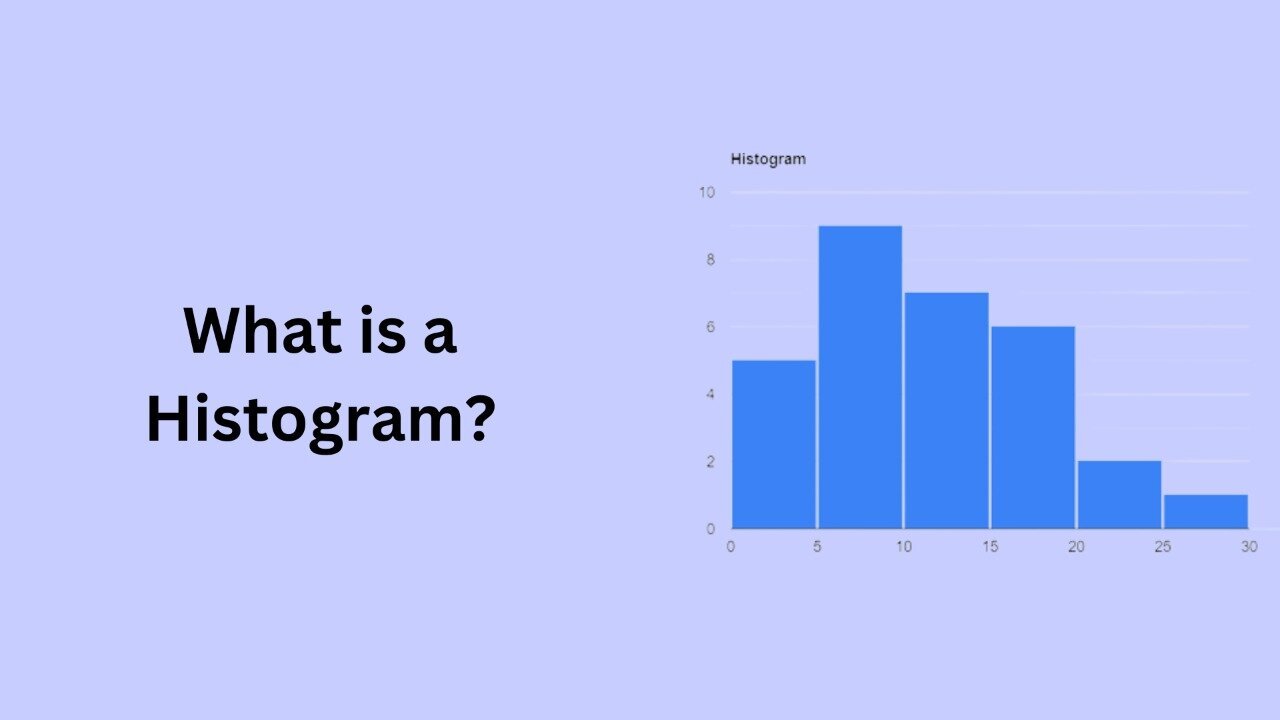
A histogram is a graphical representation of the distribution of numerical data. It is a type of bar chart that shows the frequency or number of observations within different numerical ranges, called bins. The bins are usually specified as consecutive, non-overlapping intervals of a variable. The histogram provides a visual representation of the distribution of the data, showing the number of observations that fall within each bin.
Histograms are a useful tool for visualizing the distribution of numerical data, and for identifying patterns and trends in the data. They are commonly used in statistical analysis, and are a standard feature in many statistical software packages.
To create a histogram, you first need to specify the bins or intervals that you want to use to group the data. The bins should be chosen in a way that accurately represents the distribution of the data, and that allows you to see any patterns or trends in the data.
Another type of data that is well-suited for a histogram is data that is skewed, or has a long tail on one side. A skewed distribution is one that is not symmetrical, and has a longer tail on one side than the other. A histogram is a useful tool for visualizing a skewed distribution, as it shows the frequency of observations within different bins, allowing you to see the shape of the distribution and the presence of any outliers.
Once the bins are specified, you can count the number of observations that fall within each bin, and create a bar for each bin on the histogram. The height of each bar represents the frequency or number of observations within that bin.
A histogram can be used to visualize the distribution of a single numerical variable, or to compare the distribution of multiple numerical variables. It can also be used to identify outliers in the data, or to identify clusters or gaps in the data.
In addition to visualizing the data, histograms can also be used to calculate summary statistics, such as the mean, median, and mode of the data. This can be useful for understanding the data and for making decisions based on the data.
In conclusion, a histogram is a graphical representation of the distribution of numerical data. It is a useful tool for visualizing the data, and for identifying patterns and trends in the data. Histograms are commonly used in statistical analysis, and can provide valuable insights into your data.