What is the difference between the Bar graph and a Histogram?
A bar graph and a histogram are two common types of graphical representations of data. While they may look similar, there are some key differences between the two that are important to understand.
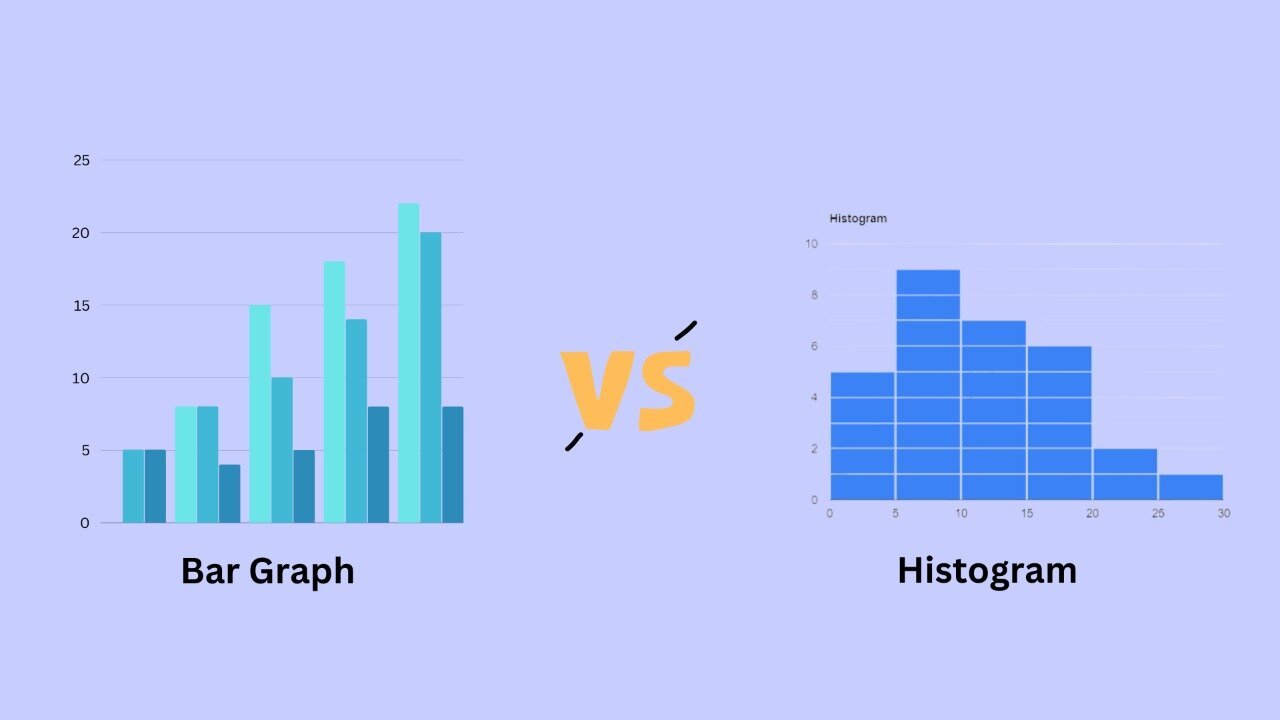
A bar graph is a chart that uses bars to represent the frequency or quantity of different categories of data. The bars can be either vertical or horizontal, and they are typically arranged either horizontally or vertically to make it easy to compare the different categories. Bar graphs are useful for displaying data that can be divided into discrete categories, such as the number of students in different grade levels at a school.
A histogram, on the other hand, is a graph that shows the distribution of numerical data. It is a type of bar chart that shows the frequency or number of observations within different numerical ranges, called bins. The bins are usually specified as consecutive, non-overlapping intervals of a variable. The histogram provides a visual representation of the distribution of the data, showing the number of observations that fall within each bin. This can be useful for identifying patterns and trends in the data, and for making comparisons between different datasets.
One of the key differences between a bar graph and a histogram is the type of data they are used to represent. A bar graph is used to represent categorical data, while a histogram is used to represent continuous numerical data. This means that a bar graph is used to compare different categories, while a histogram is used to show the distribution of a single variable.
Another difference between a bar graph and a histogram is the way the data is organized. In a bar graph, the categories are usually arranged along the horizontal or vertical axis, with the bars representing the frequency or quantity of each category. In a histogram, the bins are arranged along the horizontal axis, with the vertical axis representing the frequency or number of observations within each bin.
Another key difference between a bar graph and a histogram is the way the bars are scaled. In a bar graph, the bars can be any size, and they are typically scaled to make it easy to compare the different categories. In a histogram, the bars are scaled so that they have the same width, which allows for accurate comparisons between the different bins.
In conclusion, while a bar graph and a histogram may look similar, there are some important differences between the two. A bar graph is used to represent categorical data, while a histogram is used to represent continuous numerical data. A bar graph is used to compare different categories, while a histogram is used to show the distribution of a single variable. And a bar graph uses bars of varying sizes, while a histogram uses bars of equal width. Understanding these differences can help you choose the right type of graph for your data.